Optimize Android app performance
Android will provide some tools in the dev settings that help you optimizing the performance of your apps. You can display "overdraw" information and see layout borders. Both options can help in improving your app performance.
There are some other best practice tips at https://titaniumsdk.com/guide/Titanium_SDK/Titanium_SDK_Guide/Best_Practices_and_Recommendations/
Be up to date
Always make sure you run the latest SDK version and check if there are updates to the modules you are using. Especially TableViews and ListViews have been optimized in recent Titanium SDK versions.
ListView/TableView
The internal components use RecyclerViews for both ListView and TableView. So the base structure is the same on both platforms. Still you should use a ListView when you have fixed layouts and just want to render the data. One advantage is that you can define multiple templates to show your data. If you don't show an element or image most of the time you should create a different template that doesn't have that element. Use the "Show layout bounds" below to see if you have unused elements.
If you only show a list of the same items you can use the property fixedSize:true to enable some optimizations.
Loading lots of data can also reduce performance. If you can use a lazy load system that will reload and add data when you e.g. scroll down the list. One example can be seen in this post https://github.com/tidev/titanium-sdk/discussions/13043
Layout complexity
One bottle neck is the complexity of your layouts - especially in ListViews or TableViews where you have the same layout multiple times. Nesting many elements can help you placing your objects in your scene but it will reduce the performance quiet a lot.
If you can: try to reduce child elements and put your elements in your parent.
Also: using a horizontal/vertical layout will reduce the performance slightly since it has to calculate the space for each element. It might be harder to remove that but if you just place a text below a single line headline you can use top values instead of a vertical layout.
Most of the time you will have some elements that are only visible for e.g. users that are logged in. Instead of hiding them you can remove them completely: $.window.remove($.element)
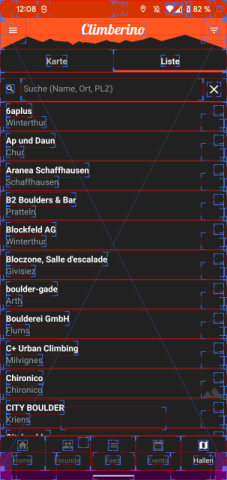
To see all your views and bounding boxes you can switch on: settings -> developer options -> "Show layout bounds"

This will help you to position elements and you can see empty boxes for elements that are loaded but not rendered.
Reduce overdraw
Another area that will help to improve performance is reducing overdrawing in your app. Android says:
An app may draw the same pixel more than once within a single frame, an event called overdraw. Overdraw is usually unnecessary, and best eliminated. It manifests itself as a performance problem by wasting GPU time to render pixels that don't contribute to what the user sees on the screen.
https://developer.android.com/topic/performance/rendering/overdraw
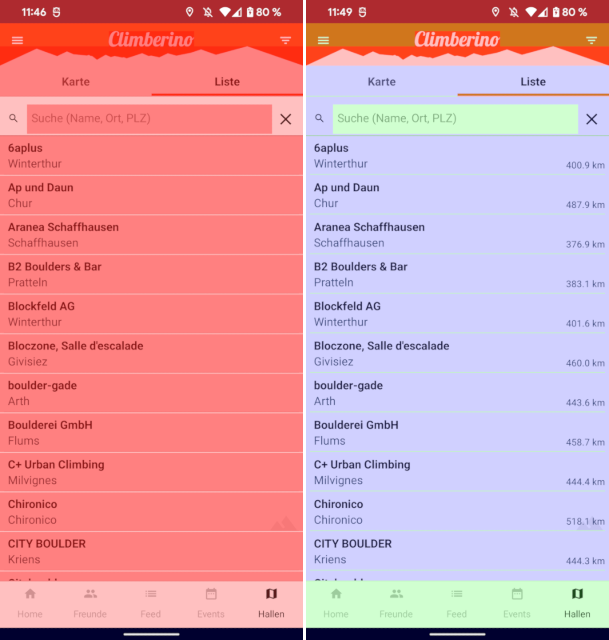
If you enable the overdraw feature settings -> developer options -> Hardware accelerated rendering -> Debug GPU Overdraw -> Show overdraw areas you will see a colorful screen with good or bad areas:

It will show you how often a pixel is redrawn which is bad for the drawing performance: red = 4x+, green = 2x, blue = 1x, original color = no redraw. Of course we are trying to go for the lowest number! To do that we just remove unnecessary backgroundColors: remove ListView backgrounds, ListItem backgrounds, ScrollView backgrounds if your window has the same background color.
Crossing the bridge
And old but still valid optimization is to reduce the number of "crossing the bridge" calls. Every time you change a property that will change UI elements Titanium will go from native to JS and back. Instead of changing multiple properties after each other you can call applyProperties({}) and pass a list of all properties to it.
Changing from Ti.App.fireEvent to Backbone events (e.g. with this tutorial) will help to reduce crossing the bridge since it will handle all events inside JS and not through the SDK.
Open event
Minimize the initial code that is executed when you create a controller or alloy.js. Try to do the heavy stuff inside the open event and present a loading indicator. That way the window opens quicker and it feels better for the user.
Optimize images
Try using a tool like https://imageoptim.com/mac to optimize and reduce size of your images.
Fonts caching
Layout inflation and resource retrieval are synchronous tasks. By default, the first attempt to retrieve fonts triggers a request to the font provider, and therefore increases the first layout time. To avoid the delay, you can pre-declare fonts that need to be retrieved in your manifest. After the system retrieves the font from the provider, it is available immediately. If font retrieval takes longer than expected, the system aborts the fetching process and uses the default font.
(source)
To do that you can create a file in app/platform/android/res/values/arrays.xml with this content (use your font names):
<?xml version="1.0" encoding="utf-8"?>
<resources>
    <array name="preloaded_fonts" translatable="false">
        <item>@fonts/BebasNeue</item>
        <item>@fonts/MaterialIcons</item>
        <item>@fonts/remixicon</item>
        <item>@fonts/materialdesignicons-webfont</item>
    </array>
</resources>
and add this into tiapp.xml:
<application android:hardwareAccelerated="true">
    <meta-data android:name="preloaded_fonts" android:resource="@array/preloaded_fonts"/>
</application>
Debugging
You can use the Profiler inside Android Studio to debug memory, network and other parts. Once you've build your app you can open the build/android folder with Android Studio and there you can start a debug build and use the Profiler. Check https://developer.android.com/studio/profile for more information about the Android Studio Profiler.